We deliver
exceptional data visualizations
to serve finance & controlling professionals.
SERVICES

Data Visualisation
We are passionate data visualization artists and finance & controlling experts. We know and understand finance departments’ challenges and design highly performant Tableau dashboards to support their processes in the best possible way.

Data Engineering
We use SQL, Tableau Prep and other tools to prepare finance & controlling data and leverage advanced analytics. Our data sources are trustworthy and optimized for visualization purposes.

Inspiration & Training
We share all our tricks. Our talks and presentations inspire big audiences at conferences as well as small analytics teams. We conceptualize trainings which are 100% customized and empower our customers to maintain our solutions and to adopt them to future challenges.


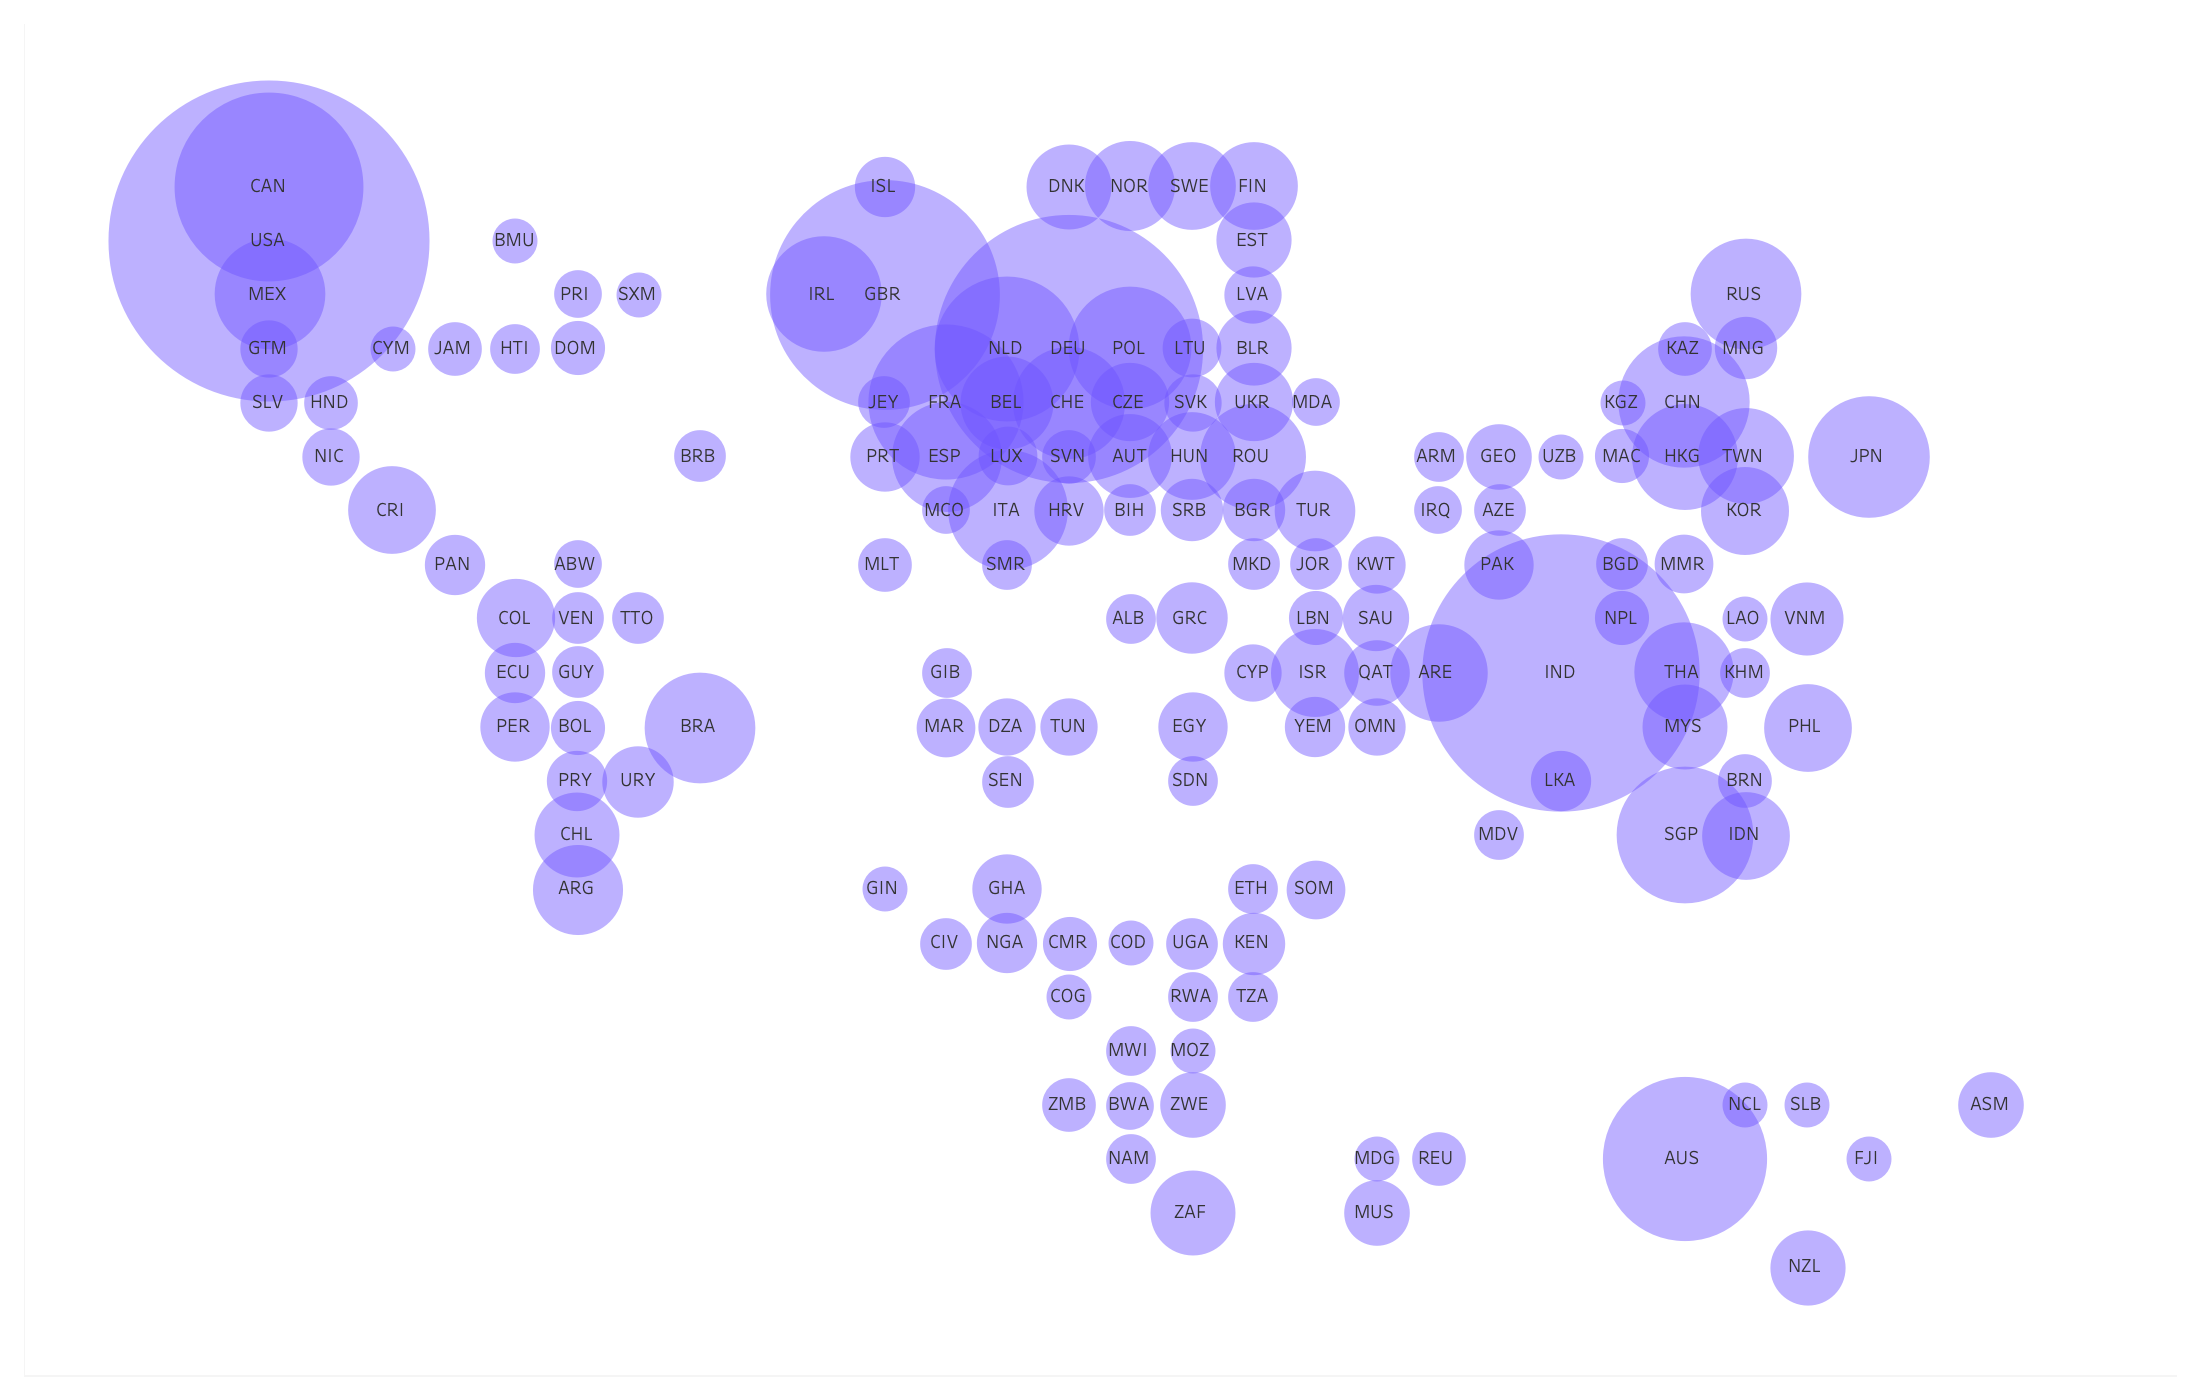
ORIGINS OF READERS
ABOUT
Klaus Schulte
CO data and vizjockey.com are led by Dr. Klaus Schulte. Klaus is a professor of controlling at Münster School of Business at FH Münster in Germany. He won Iron Viz at Tableau Conference Europe in 2018 and has been recognized as a Tableau Zen Master.
Vizjockey.com
Established in 2018, our blog has been a learning resource for people in 150 countries to date. Innovative ways to use Tableau are shared by a group of different authors. The Becoming a Tableau Desktop Specialist series has become a standard resource to prepare for Tableau’s Desktop Specialist Certification exam.

CO data
We are a virtual organization and happy to take opportunities everywhere in the world. We collaborate with local data visualization talents and data visualization experts from all around the globe.
BLOG
Show more →![Thumbnail [100%x225]](https://i0.wp.com/vizjockey.wpcomstaging.com/wp-content/uploads/2023/11/dm1-1.png?fit=1200%2C675&ssl=1)
Nov 15, 2023
Data Mapping For Everyone
I’m just coming back from Vizit Berlin, a two-day-event organized from the Tableau community (thank you Sarah, Heidi, Annabelle & Tore) for the community. It was so great to reconnect with old friends and make new friends. I also had the pleasure to give a presentation on the first day, where I introduced two ways […]
![Thumbnail [100%x225]](https://i0.wp.com/vizjockey.wpcomstaging.com/wp-content/uploads/2023/09/Income-Statement-Budget.png?fit=3152%2C2044&ssl=1)
Sep 15, 2023
14 Tips to Let Your Tableau Income Statement Shine
I recently shared my makeover of the Tableau Income Statement (+Budget) accelerator on LinkedIn and on Tableau Public. It’s a pure Tableau viz, without any data preparation or map layers in place. I have used several tricks here, to achieve this layout in a one sheet view and I’m happy to share them all 🤓. […]
![Thumbnail [100%x225]](https://i0.wp.com/vizjockey.wpcomstaging.com/wp-content/uploads/2022/11/FhXBvenXEAAU4Ok.jpeg?fit=1200%2C650&ssl=1)
Nov 16, 2022
Converting NetCDF files to .hyper for use in Tableau
Recently, Klaus Schulte asked for some help with wrestling NetCDF files into Tableau. To help out, I wrote up a little Python script to pull the data out and convert it to a .hyper file for use in Tableau and figured that I should go ahead and document how to work with NetCDF in Tableau and […]
![Thumbnail [100%x225]](https://i0.wp.com/vizjockey.wpcomstaging.com/wp-content/uploads/2022/10/header_blog.jpg?fit=1200%2C674&ssl=1)
Oct 12, 2022
World Population Cartograms
In one of my recents projects, I’ve created a world population cartogram. In such a map, country size represents population. Each one-by-one square stands for 500,000 people. Each country exists of as many squares as needed to represent its population. About Cartograms According to Max Roser, founder of OurWorldInData, this is “the map we need […]